RL Blogs
By Market Analyst Dan
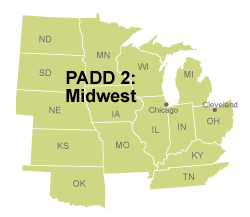
Jul 22, 2012A high level summary of PADD2 refinery configuration and production yield as compared to the rest of U.S. Refining. |
||||||||||||
that 20% of U.S. refining capacity resides in the Midwest. That in itself doesn’t carry much intrigue factor. What should interest you; however, is how the configuration of refineries in PADD 2 differ from others in the U.S. oil industry.
Refinery configuration matters since feedstock flexibility and product yield capability contribute significantly to refinery profitability.
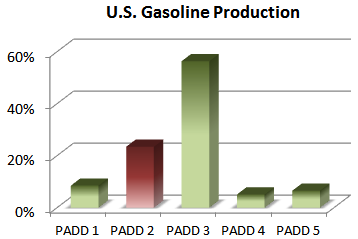
Gasoline Yields
(PADD 3) has 50% U.S. refining capacity, but only accounted for 45% of the gasoline production in that same year.
Gasoline vs Distillate Yields
To spin this at a different angle, let’s rewind time by 4 years and compare product yield between the two regions. In 2007 when gasoline prices were at a premium, the U.S. Gulf Coast favored gasoline production vs distillate production to maximize refinery profitability.
PADD 3 Gasoline production as a percentage of overall U.S. production was over 10% higher in 2007 than in 2011. Over the same years of comparison, PADD 2 contribution was 6 % lower.
The refiners in the Midwest are no dummies. Surely they would like to maximize distillate production when distillate prices are at a premium, and vice versa when gasoline prices take charge. What limits PADD 2 refiners from taking advantage of market economics is their refinery configuration.
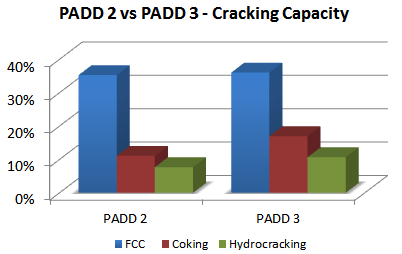
Conversion Unit Comparison
By comparing capacities of cracking units, you can see that PADD 2 refineries do
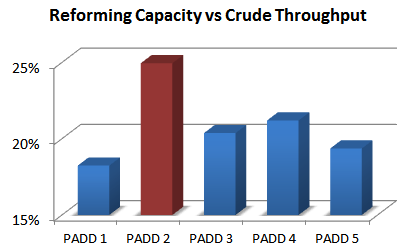
While octane balance had some motivating factor, the primary driver for large reformers in the Midwest is the demand for Hydrogen.
Location Disadvantage – H2 Supply
Unlike the Gulf Coast and the West Coast, refineries in the Midwest are not concentrated in dense areas. Without economy of scale to build large hydrogen production facilities onsite or nearby, many PADD 2 refineries leverage naphtha reformers to supply hydrogen for refinery consumption.
Lack of alternate hydrogen supply in today’s market environment create large disadvantages for PADD 2 refineries. This limits the amount of naphtha that can be converted to jet fuel when distillate prices fetch a premium.
Additionally, PADD 2 refiners cannot take advantage of depressed natural gas prices. Other regions enjoy the large margin of converting natural gas to hydrogen, and then converting the hydrogen to refined liquid product.
Given the lack of manufactured hydrogen availability, PADD 2 refineries have configuration requirements that constrain gasoline yields to a higher amount than other PADDs.
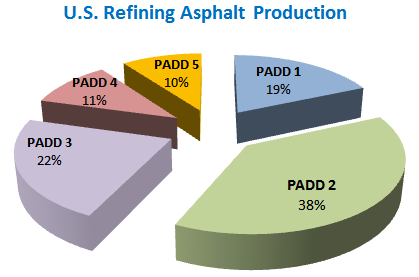
Holy Asphalt
Roughly 85% of the asphalt consumption in the U.S. is comprised of road paving demand, and 40% of total asphalt demand originates in the Midwest.
maintain driver safety during the winter have a very detrimental effect on durability. This results in higher rates of re-paving.
As the old saying goes, “there are only two seasons in the Midwest... winter and construction”.
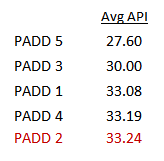
Location Advantage - Crude Supply
Need I say more about this? Crude margins in PADD 2 are significantly higher than that of most other regions. In contrast to the location disadvantages noted previously, the lack of logistic accessibility in this region creates significant margin advantages that outweigh the disadvantages.
Since majority of the crude production and receipt (from Canada) in the Midwest have limited shipping outlets, PADD 2 refiners historically received significant discounts on crude purchases. Midwest crude refining margins have reached $30 - $50 /bbl, as compared to margins of $2 - $10 /bbl on the Gulf Coast. That is just absurd!
Given the dynamic relationship of oil consumers and producers throughout the United States, it’s powerful to understand the macro fundamentals. Whether market volatility is introduced by international or domestic forces, knowledgeable appreciation of refinery configuration differences between regions prove helpful. | ||||||||||||
|
|
.png)
.png)