RL Blogs

By Market Analyst Dan
Sep 12, 2016A simple overview of the U.S. PADD system and how we can use the data to understand supply chain fundamentals and optimization. |
||||
| PADD General
Today, these regions are still used for data collection purposes and are very helpful in understanding the supply & demand balances of the domestic petroleum business. Hot issues such as Keystone pipeline, Bakken oil developments, WTI Price Volatility, East Coast refinery closures, and USGC Hurricane impacts can all be easily rationalized by understanding the basics of PADD classification.
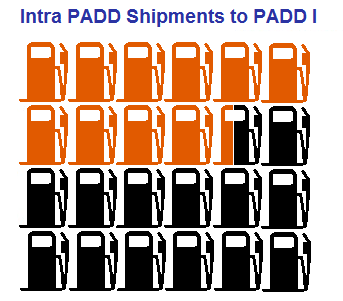
West Coast. Many would also be surprised to learn that less than 10% of the US refining capacity resides on the East Coast. Roughly one-third of the U.S. population is on the East Coast, but less than a tenth of the refining capacity is in that region.
Roughly 1/3 of the U.S. population is on the East Coast, but less than 1/10 of refining capacity is in that region
With little oil refining infrastructure and high demand, one can imagine that a great deal of logistics is required to supply consumers on the east coast. Majority of this is managed by pipelines, but let’s not forget that rail, trucks, and barges are also required for the logistic network to remain whole.
balanced the rest of PADD I demand, recent market shifts have increased supply from the Gulf and decreased international imports.
Although the Midwest (PADD II) has 20% of the U.S. refining capacity, it historically supplies 85% of consumer demand from refineries within the region. As a result PADD II required product imports from PADD III, primarily through the Explorer Pipeline.
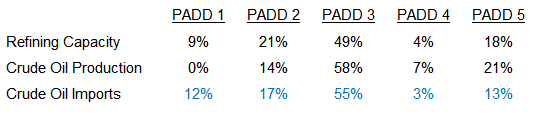
PADD Crude Supply
When comparing refining capacity with crude supply, it becomes quickly apparent that a good amount of crude movements happen within U.S. PADDs.
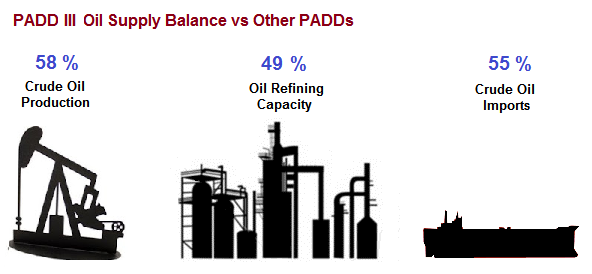
Although 49% of US refining capacity resides in PADD III, notice how 58% of domestic crude is produced in PADD III and 55% of net crude imports also go to PADD III. This implies that crude oil must move out of PADD III to other PADDs to remain balanced. As a matter of fact, roughly 1.4 Million barrels a day of oil moves from PADD III to PADD II and PADD IV.
Now that I’ve provided you with a quick overview of the U.S. PADD system, you will now be armed with knowledge to understand fundamental drivers of the U.S. oil supply chain. | ||||

.png)